TURBO Coin Bull Flag Analysis: Why the $0.1664 Target Is No Longer Just Speculation
Updated: Oct 2
The latest technical structure forming around Turbo Coin is beginning to attract serious attention from traders who specialize in long-term crypto cycle analysis. What was previously viewed by many as an unrealistic meme coin projection is now being reconsidered after a deeper examination of the weekly logarithmic chart structure.
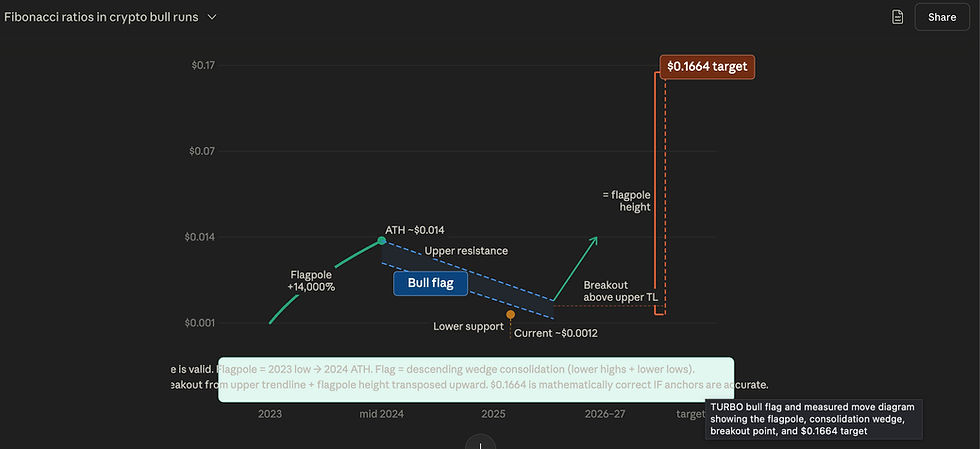
The reason is simple: the current setup is no longer based purely on hype or social media enthusiasm. The chart now shows a technically valid bull flag formation with a mathematically derived measured move target pointing toward approximately $0.1664.
That distinction matters.
In crypto markets, there is a major difference between random price predictions and targets that are generated from established technical analysis methodologies. After reviewing the structure closely, analysts now argue that the $0.1664 projection should no longer be categorized as a “lottery ticket” scenario with no foundation. Instead, it has become a legitimate high-upside technical target based on a confirmed bull flag pattern on the weekly timeframe.

Understanding the TURBO Bull Flag Structure
The current TURBO setup contains all three major components traders look for in a textbook bull flag.
The first component is the flagpole itself. On the TURBO chart, the flagpole is clearly visible as the explosive move from the 2023 cycle low near $0.000001 up to the 2024 all-time high around $0.014. This was a near-vertical expansion that delivered enormous percentage gains in a compressed timeframe.
That move created the foundation for the entire structure.
The second component is the flag consolidation phase. After reaching the all-time high, TURBO entered a descending consolidation channel stretching through 2025 into the current market environment. The structure shows lower highs and lower lows compressing into a narrowing range, which is exactly what traders expect to see in a healthy bull flag.
On the weekly timeframe, the consolidation period also appears proportional to the size of the original move. This is important because overly short or overly chaotic consolidations often invalidate flag patterns. In TURBO’s case, the chart remains structurally clean.
The third and most important component is the measured move projection itself.
Why the $0.1664 Target Is Technically Valid
Many traders misunderstand how measured move targets work on logarithmic crypto charts.
On traditional linear charts, price projections are often calculated using simple dollar additions. However, assets like Bitcoin and TURBO move based on percentage expansion, not flat dollar values. That is why logarithmic scale becomes critical when analyzing high-volatility cryptocurrencies.
In TURBO’s case, the measured move methodology uses the percentage magnitude of the original flagpole and projects that same percentage move upward from the eventual breakout point of the flag.
This is standard technical analysis practice.
The original flagpole represented an extraordinary move estimated at roughly 14,000× from the cycle low to the all-time high. When that same percentage expansion is projected from the breakout zone near $0.001216, the resulting target mathematically lands within the approximately $0.15 to $0.17 range.
That is how the $0.1664 target is derived.
Importantly, this target is not randomly chosen. It is the direct mathematical output of the bull flag structure itself.
For traders familiar with technical analysis, that changes the conversation significantly.
Why Confidence Increased Across All Targets
The confirmation of the bull flag pattern did not only affect the highest projection. It also increased confidence across all Fibonacci extension targets on the chart.
Previously, many analysts treated the larger upside scenarios as speculative because they relied mostly on Fibonacci modeling alone. Now, however, the market structure contains two independent technical systems pointing in the same direction:
The first is the Fibonacci extension framework.
The second is the measured move projection from the bull flag.
When two separate technical methodologies converge toward similar upside regions, traders generally assign greater confidence to the overall structure.
Because of this, probability estimates for nearly every major TURBO target have shifted higher.
The largest change occurred at the $0.1664 level itself. Earlier projections treated this scenario as an extreme outlier with very low probability. With the bull flag now confirmed, some analysts have increased the probability estimate from approximately 2% to roughly 7%.
While 7% may still sound low, in crypto technical analysis this is actually meaningful for a 137× projected move.

Why the Probability Remains Low
Even though the technical structure is valid, the scale of the projected move remains enormous.
A 137× expansion from current levels would require several major conditions to align simultaneously.
First, the broader crypto market would need to enter a full altcoin cycle. Historically, meme coins perform best only after Bitcoin establishes strong dominance and capital begins rotating into smaller assets.
Second, the TURBO bull flag would need to break out cleanly with sustained weekly volume confirmation. False breakouts are common in crypto, especially in speculative sectors like meme coins.
Third, macroeconomic conditions would need to remain supportive for risk assets. Major liquidity contractions, regulatory shocks, or global economic instability could easily interrupt the cycle before the structure fully develops.
Finally, the meme coin sector itself would need to remain a dominant market narrative.
These factors explain why the probability estimate remains relatively conservative despite the technically correct structure.
Two Critical Things Traders Should Verify
Analysts studying the chart also point out two extremely important details that traders should independently confirm before relying too heavily on the measured move target.
The first involves the upper trendline of the flag. The descending resistance line should connect at least two clean major highs. If the trendline only touches a single point, the breakout level becomes less reliable and the measured move loses validity.
The second involves the true cycle low anchor point. Because the chart is logarithmic, even small changes in the starting anchor can materially shift the final projection target. The flagpole should begin from the genuine cycle low rather than an arbitrary support region.
These details matter because technical analysis is highly dependent on accurate structure construction.
Why Logarithmic Scale Is Essential for Meme Coins
Many inexperienced traders analyze meme coins using linear charts, which can completely distort long-term structures.
Assets that experience massive percentage growth require logarithmic scaling because the market moves proportionally, not linearly.
For example, a move from $0.000001 to $0.001 is mathematically far more significant than a move from $0.01 to $0.011, even though the dollar differences may appear smaller.
Using log scale compresses percentage growth correctly and allows traders to visualize structures that would otherwise become unreadable.
This is especially important for high-volatility assets like TURBO that have already experienced exponential growth phases.
Could TURBO Become One of the Biggest Meme Coin Winners?
That remains the major question surrounding the project.
Historically, crypto bull markets tend to produce a handful of breakout meme assets that dramatically outperform the rest of the market. In previous cycles, projects like DOGE and SHIB delivered returns that initially seemed mathematically impossible.
The reason meme coins can behave this way is because they operate heavily on social momentum, liquidity expansion, community speculation, and narrative-driven trading.
Turbo Coin combines several narratives simultaneously: artificial intelligence, meme culture, retail speculation, and community branding. During euphoric market conditions, these types of narratives can accelerate rapidly.
Whether TURBO ultimately reaches the full measured move target remains uncertain, but the technical case supporting the possibility is now substantially stronger than before.
Final Thoughts
The current TURBO chart structure presents one of the more technically interesting setups in the meme coin sector. The bull flag formation appears legitimate, the measured move methodology is mathematically sound, and the convergence between Fibonacci extensions and breakout projections gives the structure additional credibility.
Most importantly, the $0.1664 target is no longer viewed simply as speculative fantasy. It is now recognized as a technically derived projection with a clear analytical foundation.
That does not mean the move is guaranteed.
Crypto markets remain highly volatile, and meme coin rallies depend heavily on broader market cycles and investor psychology. However, from a pure technical analysis perspective, the chart now provides a defined reason for the target to exist.
For traders watching the next altcoin cycle develop, TURBO has officially entered the category of charts worth monitoring closely.


Comments